Bayesian toolbox for quantitative proteomics. In particular, this package provides functions to generate synthetic datasets, execute Bayesian differential analysis methods, and display results.
Installation
You can install the released version of ProteoBayes from CRAN with:
install.packages("ProteoBayes")You can install the development version of ProteoBayes like so:
# install.packages("devtools")
devtools::install_github("mariechion/ProteoBayes")
If you want to use ProteoBayes without coding a single line, feel free use our dedicated web app: https://arthurleroy.shinyapps.io/ProteoBayes/.
For those who are keen to learn more about the R code behind, just scroll down below!
ProteoBayes in a nutshell
Generate a synthetic proteomics dataset with the correct format:
library(ProteoBayes)
set.seed(42)

## Generate a dataset without imputations
data = simu_db()

## Generate a dataset with multiple imputations
data_imp = simu_db(multi_imp = TRUE)

data
#> # A tibble: 50 x 4
#>    Peptide   Group Sample Output
#>    <chr>     <int>  <int>  <dbl>
#>  1 Peptide_1     1      1   48.8
#>  2 Peptide_1     1      2   46.5
#>  3 Peptide_1     1      3   49.8
#>  4 Peptide_1     1      4   49.9
#>  5 Peptide_1     1      5   47.4
#>  6 Peptide_1     2      1   54.9
#>  7 Peptide_1     2      2   49.4
#>  8 Peptide_1     2      3   52.0
#>  9 Peptide_1     2      4   49.6
#> 10 Peptide_1     2      5   55.0
#> # i 40 more rows
data_imp
#> # A tibble: 250 x 5
#>    Peptide   Group Sample Output  Draw
#>    <chr>     <int>  <int>  <dbl> <int>
#>  1 Peptide_1     1      1   51.8     1
#>  2 Peptide_1     1      1   51.3     2
#>  3 Peptide_1     1      1   51.6     3
#>  4 Peptide_1     1      1   51.9     4
#>  5 Peptide_1     1      1   51.8     5
#>  6 Peptide_1     1      2   52.5     1
#>  7 Peptide_1     1      2   52.6     2
#>  8 Peptide_1     1      2   52.0     3
#>  9 Peptide_1     1      2   52.0     4
#> 10 Peptide_1     1      2   50.8     5
#> # i 240 more rows
The parameters of all posterior distributions can be computed thanks to:
post = posterior_mean(data)

post
#> # A tibble: 10 x 6
#>    Peptide   Group    mu lambda alpha  beta
#>    <chr>     <int> <dbl>  <dbl> <dbl> <dbl>
#>  1 Peptide_1     1  48.8      6   3.5  6.81
#>  2 Peptide_1     2  51.9      6   3.5 17.2
#>  3 Peptide_2     1  51.5      6   3.5  3.54
#>  4 Peptide_2     2  53.5      6   3.5 10.6
#>  5 Peptide_3     1  18.6      6   3.5  6.61
#>  6 Peptide_3     2  20.9      6   3.5 11.8
#>  7 Peptide_4     1  44.0      6   3.5  7.00
#>  8 Peptide_4     2  46.0      6   3.5 17.8
#>  9 Peptide_5     1  34.0      6   3.5 30.7
#> 10 Peptide_5     2  37.7      6   3.5  5.40
When considering Peptides independently (no inter-Peptides correlations), the method is unaffected by missing values and no imputation is necessary.
We can also consider correlations between Peptides by using a multivariate version of the method. In this context, missing values need to be imputed beforehand (multiple imputations is accepted), and the dedicated function is:
post_imp = multi_posterior_mean(data_imp)

post_imp
#> # A tibble: 250 x 8
#>     Draw Group Peptide   Peptide2     mu lambda    nu  Sigma
#>    <int> <int> <chr>     <chr>     <dbl>  <dbl> <dbl>  <dbl>
#>  1     1     1 Peptide_1 Peptide_1  50.4      6    15 57.4
#>  2     1     1 Peptide_1 Peptide_2  50.4      6    15 -1.25
#>  3     1     1 Peptide_1 Peptide_3  50.4      6    15 11.5
#>  4     1     1 Peptide_1 Peptide_4  50.4      6    15 -8.05
#>  5     1     1 Peptide_1 Peptide_5  50.4      6    15 -3.92
#>  6     1     1 Peptide_2 Peptide_1  41.7      6    15 -1.25
#>  7     1     1 Peptide_2 Peptide_2  41.7      6    15  6.08
#>  8     1     1 Peptide_2 Peptide_3  41.7      6    15  2.85
#>  9     1     1 Peptide_2 Peptide_4  41.7      6    15 -0.206
#> 10     1     1 Peptide_2 Peptide_5  41.7      6    15 -2.40
#> # i 240 more rows
Once parameters of the posterior distributions are available. We can sample from those distributions and visualise the differences between any groups for each peptide by using:
sample = sample_distrib(post)

plot_distrib(sample, group1 = 1, group2 = 2, peptide = 'Peptide_1' )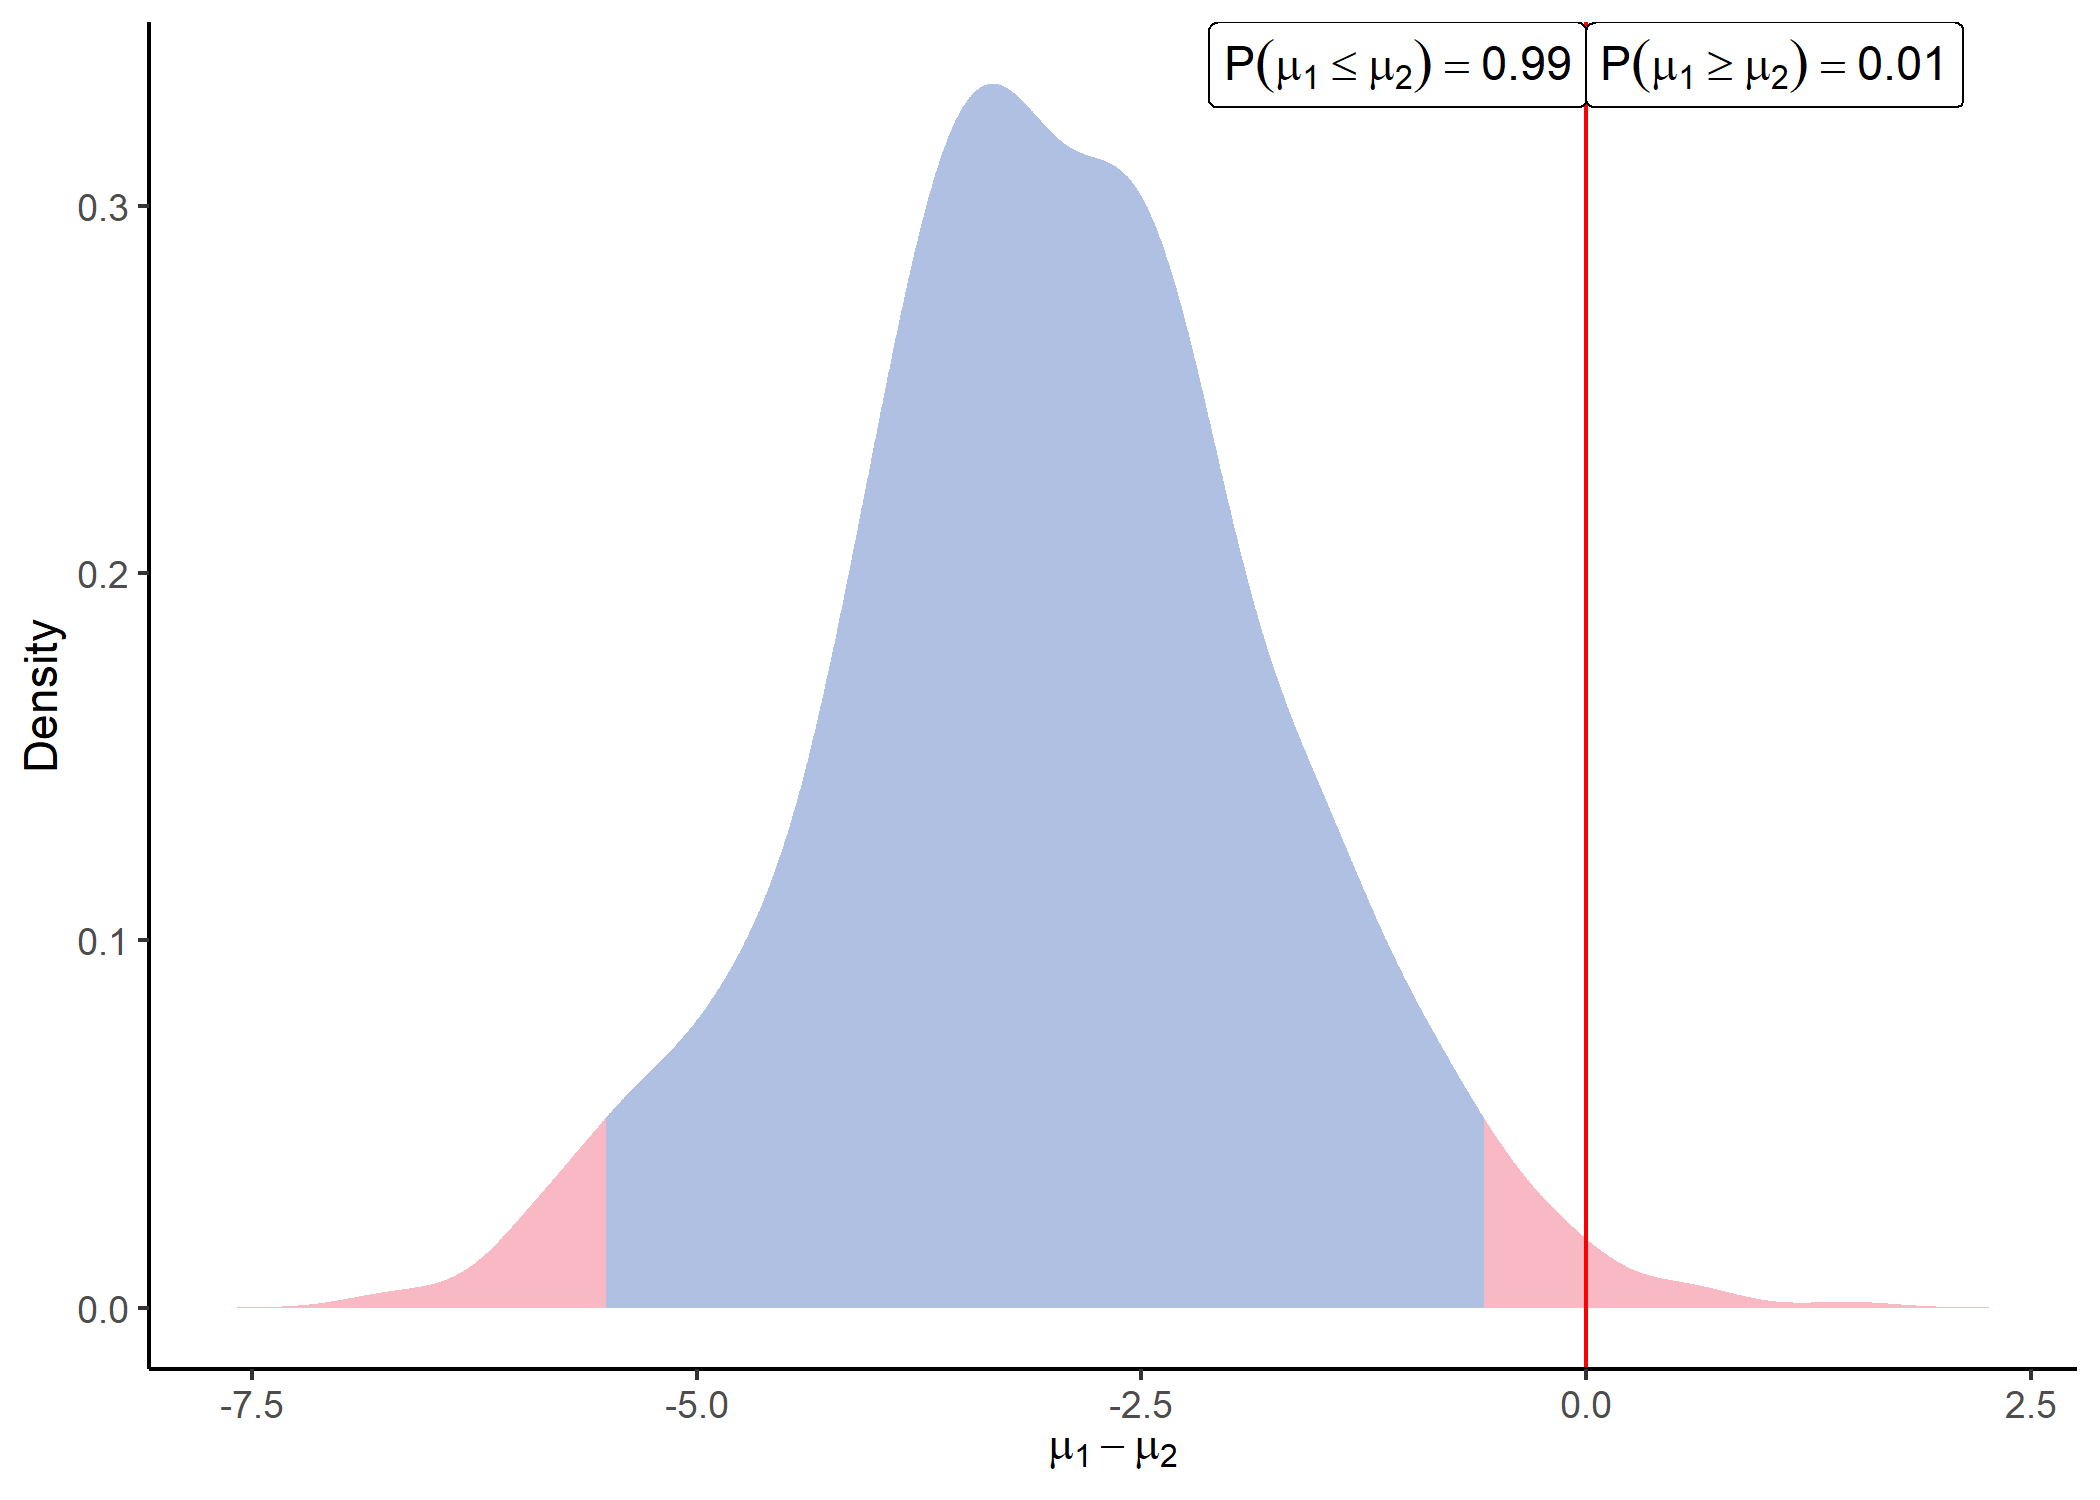
When comparing a large number of Peptides simultaneously, the function identify_diff() can be used to check for probable differences between groups for each Peptide:
identify_diff(post)
#> # A tibble: 10 x 10
#>    Peptide   Group    mu CI_inf CI_sup Group2   mu2 CI_inf2 CI_sup2 Distinct
#>    <chr>     <int> <dbl>  <dbl>  <dbl>  <int> <dbl>   <dbl>   <dbl> <lgl>
#>  1 Peptide_1     1  48.8   47.5   50.2      2  51.9    49.7    54.0 FALSE
#>  2 Peptide_1     2  51.9   49.7   54.0      1  48.8    47.5    50.2 FALSE
#>  3 Peptide_2     1  51.5   50.6   52.5      2  53.5    51.9    55.2 FALSE
#>  4 Peptide_2     2  53.5   51.9   55.2      1  51.5    50.6    52.5 FALSE
#>  5 Peptide_3     1  18.6   17.3   20.0      2  20.9    19.1    22.7 FALSE
#>  6 Peptide_3     2  20.9   19.1   22.7      1  18.6    17.3    20.0 FALSE
#>  7 Peptide_4     1  44.0   42.6   45.4      2  46.0    43.8    48.2 FALSE
#>  8 Peptide_4     2  46.0   43.8   48.2      1  44.0    42.6    45.4 FALSE
#>  9 Peptide_5     1  34.0   31.1   36.8      2  37.7    36.5    38.9 FALSE
#> 10 Peptide_5     2  37.7   36.5   38.9      1  34.0    31.1    36.8 FALSE